The Overall Guide to Twitter Analytics for Business Profiles: Key Metrics to Track to Increase Engagement
Understanding Twitter Analytics and using it effectively may revolutionise the way you use social media.
The data at your disposal can transform seemingly random social encounters into insights that can change your strategy, whether it's assessing which messages to connect with, finding successful campaigns, or discovering gaps in your customer service.
Unsure where to begin? With the aid of this tutorial, you and your team will be able to manage Twitter Analytics considerably better.
{{toc}}
What Is Twitter Analytics?
Twitter Analytics is a statistics dashboard that monitors your account's performance. It can provide information to improve your social media strategy, from identifying your most devoted followers to tweeting at the most appropriate time of day.
You can track and analyse key metrics with Twitter Analytics, including follower gains and losses, impressions, engagement rates, retweets and more. The technology has been around since 2014 and can be accessed from both personal and commercial Twitter accounts.
Making data-driven decisions about your social media strategy becomes easier when you use Twitter Analytics for business. With the right data, you can improve your Twitter campaigns and gain more followers without having to make assumptions about how your strategy will perform.
How to Access Twitter Analytics
Anyone with a Twitter account can view the Twitter reporting dashboard. Via the tweet-based analytics data, you can access the entire reporting dashboard from your desktop or mobile device.
If you're using a computer
To access analytics, visit https://analytics.twitter.com/about or click More → Creator Studio → Analytics.
The screenshots below show you how to do it:
- First, select ‘More’:

Source: Twitter - Next, click on ‘Creator Studio’:

Source: Twitter - Finally, select ‘Analytics’:

Source: Twitter
When you enter the Analytics section, select ‘Get started’. The Twitter Analytics dashboard should appear if it has not yet been set up.
 When using a mobile device:
Visit the tweet you want to collect information about
Tap on the lower right corner of the tweet
 Source: Twitter
How Does Twitter Analytics Work?
The following sections summarise the Twitter Analytics dashboard and metrics:
Analytics Dashboard
When you first access analytics, you'll see the Twitter Analytics dashboard. Here, you’ll find a summary of the key statistics for each month, called Twitter Highlights. The available data includes your account's most popular tweet, mention, and follower. You will then see a summary of other information for the month, including the number of tweets you posted, the number of visits to your Twitter profile, the number of mentions you received on social media, the number of new followers, the total you've added and the number of tweet impressions.
Tweet Activity Dashboard
The Tweet Activity Dashboard is a tool you can use to learn more about your tweets and how they resonate with your audience. For instance:
- See how people react to your tweets in real-time
- Compare your tweet activity and followers, and see how they trend over time
- Click on any tweet to get a detailed view of the number of retweets, replies, likes, follows or clicks it receives
- Get detailed insights into who your audience is, especially those who engage with your tweets
- Download your tweet metrics
The Tweet Activity Dashboard allows you to track insights into your brand's performance over time. The chart provides an overview of the daily impressions over the last 28 days and the overall data for the month.
The following metrics are available here:
- Tweet number
- Tweet impressions
- Profile views
- Mentions
- New followers
- Top tweet
- Top mention
- Top media tweet
 Source: Twitter
You can scroll down to see the analytics for the previous month.

Source: Twitter
By selecting 'View all tweet activity', you can see the stats for each of your tweets. You can view stats on the Tweet Activity Dashboard, where you will also find impressions and interactions with both organic and promoted ads. Tweet-level metrics are arranged in the categories Promoted Ads, Tweets and Replies, and All Tweets.
Graphs make it easy to compare stats for different months. These charts include details on impressions, engagement rate, link clicks, retweets, likes and comments. They contain information about both sponsored and unsponsored tweets. To view the definition of a metric, hover over it on the tweet detail page.
In the Tweets section, you can see statistics such as Retweets, Likes, Comments and more, which can be viewed by clicking on a tweet on the Dashboard:

Source: Twitter
You can scroll down to see more data:

Source: Twitter
You can also export data by clicking ‘Export Data’ in the upper right corner:
 Source: Twitter
Additionally, you can select a time period using the calendar date range option. In this section, you can obtain daily Twitter insights, including Impressions, Engagements, and Engagement Rate.

Source: Twitter
Video Activity Dashboard
To access this dashboard, select ‘More’ from the menu and then choose ‘Videos’ from the list.
You will see a Video Activity Dashboard where you can view data on retention rate. This represents the median Twitter view rate for your video.
 Source: Twitter
Conversion Tracking Dashboard
See how your brand's ad spend on Twitter drives installs, signups or transactions on Twitter’s conversion tracking pages. Your brand can access website conversion tracking statistics by setting a website tag.

Source: Twitter
Key Metrics to Track with Twitter Analytics
To simplify your life and avoid being deceived when you view the Twitter Analytics Dashboard, we deal with the statistics, drawing your attention to key figures and adjusting the content strategy in accordance with the data received. Learn more.
Below is a list of all the important metrics you can track via Twitter Analytics:
- Top Tweet
This is the tweet that has received the most interactions or impressions over time and performed the best. Tracking your top tweets can help you see which of your tweets are doing well, allowing you to spot any patterns or trends. This indicator helps you determine what type of material is relevant to your audience.
If you come across a tweet that is performing well, you should consider advertising it. If you are paying to have your posts promoted, upgrade to the best-performing content. - Tweets
You can view your monthly tweet output on the Twitter Analytics Dashboard home page. You can use this data to track your daily or monthly content delivery goals. - Followers
You can check the number of followers you have attracted over time using Twitter Analytics. You can also check how many followers you currently have.
Monitoring follower growth is a great idea; however, it is preferable to track metrics like post interactions and clicks, which have a direct influence on your business. If you have many followers but little engagement and interaction with your content, it won't help your business. - Profile Visits
Twitter Analytics also gives you information on how many people have visited your profile over time. This stat represents the number of users who have accessed your Twitter profile and feed.
Monitoring this indicator will show you whether or not people are engaging with more of your content than just one or two posts to learn more about you and decide whether or not to follow you on Twitter. - Top Follower
This measure informs you of the Twitter account that followed you the most frequently over the course of a month. By monitoring this indicator, you can learn about new followers with great reach and influencing potential. This measure can be used to thank a new follower by mentioning them in a tweet. This new top follower may be a strong candidate for upcoming influencer efforts. - Top Mentions
Using these Twitter Analytics stats, you can learn which tweet has had the most interactions and mentions on Twitter. Even more, it extends to other accounts that have linked to your content.
Since you may be engaging with the top-performing tweet that mentioned you, you should monitor this metric. No matter how positive or negative the tweets are, responding to them will make your brand more visible to the followers of that account. - Impressions
This is an important metric that you should monitor closely. Impressions indicate the number of times other Twitter users have naturally viewed your tweet over a period of time. Retweets and quotes from tweets are included. You can assess your impressions both at the level of your overall account and the level of an individual tweet.
Impressions allow you to estimate a tweet's potential popularity. However, using this measure, you cannot obtain the number of distinct accounts that have seen your tweet. It informs you of the tweets that have been seen by several feeds. Nevertheless, this statistic is crucial and frequently employed to assess brand awareness.
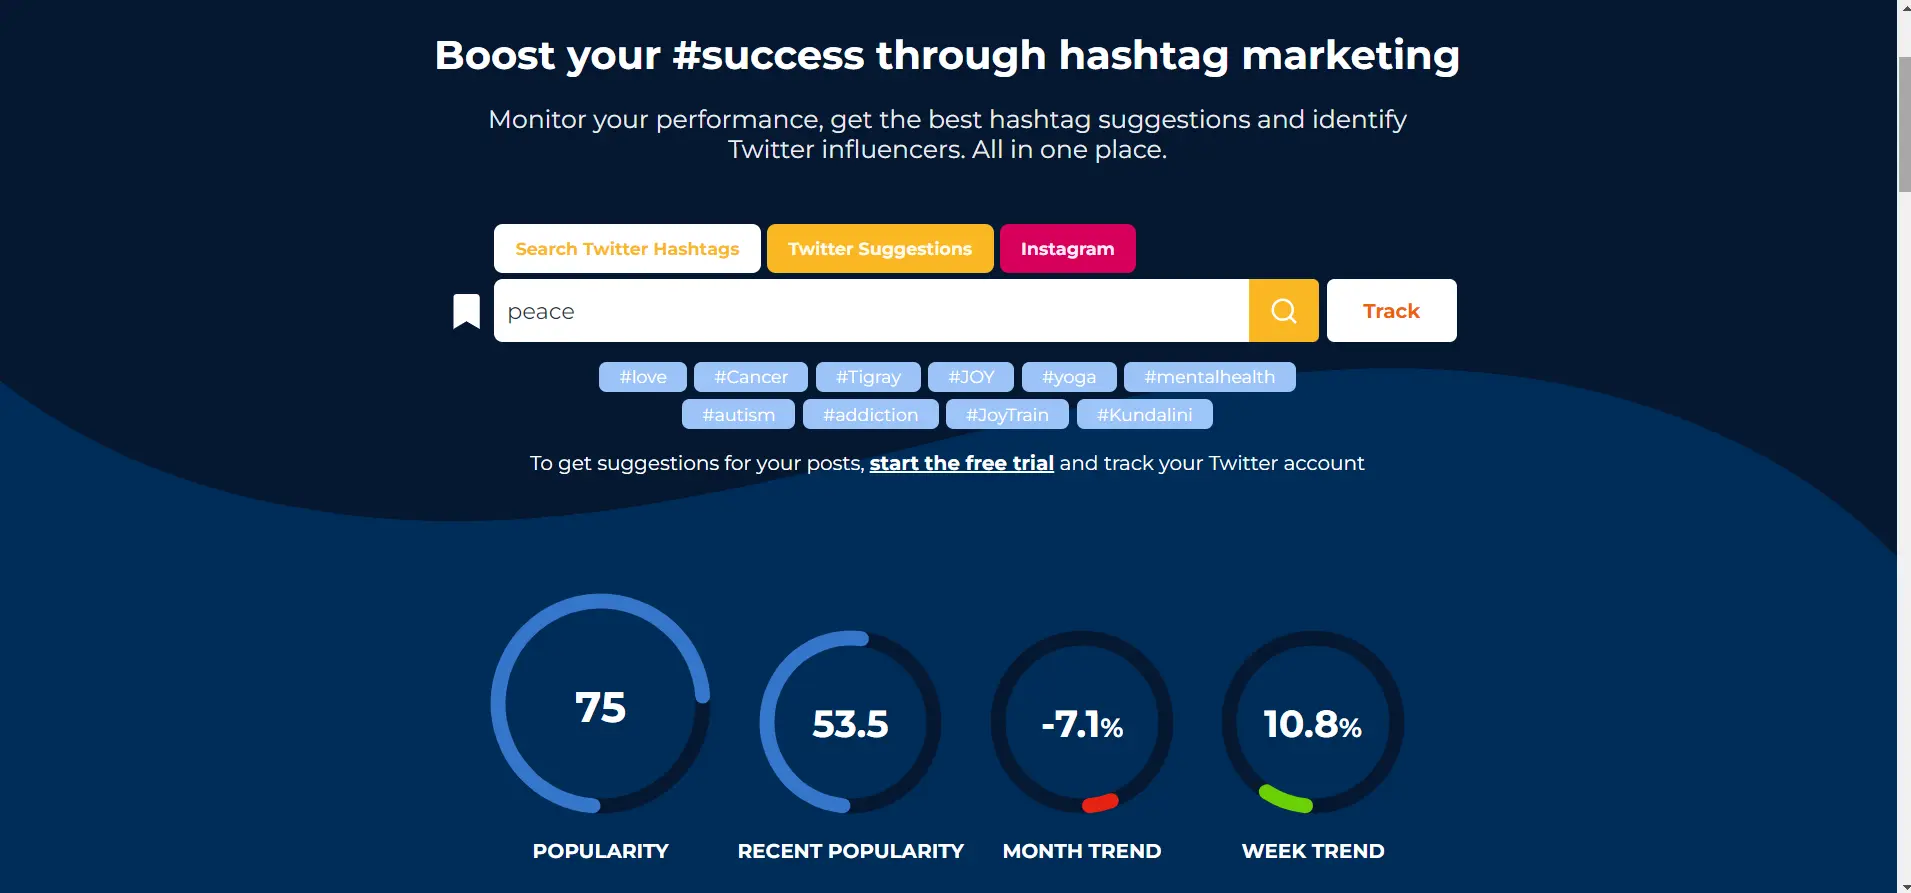
The Impression Meter is a tool for measuring your reach among your audience and letting you know which of your content resonates with them. - Hashtag Analytics
You can also track the number of views your tweet received using Twitter hashtag analytics. This matrix is useful since it enables you to determine how many people have viewed your material. You can calculate the engagement rate for each tweet, or your entire account, by combining it with the engagement measure. Sometimes, hashtags are the key to making a good impression. Play around and keep an eye on the analytics to figure out which hashtag suits you best. - Engagement
This stat makes it easy to count the number of interactions with each individual tweet. Somewhat similar to the impression indicator, you can check the number either at the account level or at the individual tweet level. Users can interact with a tweet in various ways, such as with likes, replies, retweets, link clicks, media expansions and more.
This measure is tracked because when someone takes the time to reply to your tweet, it indicates that they are interested and have discovered something fascinating about it. Knowing which tweets are working for your brand is easier when you keep track of your interactions. This stat is often used to gauge how well you are performing with respect to your brand and community engagement goals. - Link Click
Link Click tracks the number of times a link in your tweet is clicked. Using this feature, you can track whether the links you share are of interest to your readers. This indicator can also be viewed both for individual tweets and for the entire account. - Engagement Rate
This is how often people respond to your tweets. You can quickly calculate the engagement rate by dividing the total number of Twitter engagements by the total impressions.
Rather than just focusing on interaction or impressions, this metric is useful for evaluating the performance of your Twitter account as a whole. If a tweet has a high engagement rate, it means that it has stimulated a discussion. But it's worth realising that not every tweet necessarily has to have high interaction. Look at it this way, a tweet with a low engagement score but lots of impressions means it's interesting but doesn't need comments, so it's great to share!
The engagement rate is essential for directing visitors from Twitter to your website. Tweets with the highest engagement rates can be analysed to identify the factors that contributed to their success, such as captions, videos, hashtags, questions, etc. - Cost per Result (CPR)
If you have decided to use Twitter's advertising services, this metric will be useful. Every possible action a user takes on your Twitter ad will be averaged by this program.
It is essential to determine the criteria that define the success of an advertising campaign when running an advertisement on Twitter. For a Twitter ad campaign, you can monitor metrics like impressions, engagement rate, results and more.
The Benefits of Tracking Twitter Analytics for Business
Using Twitter Analytics, you can monitor and examine important data, including follower gains and losses, impressions, engagement rates, retweets, and more. The technology has been around since 2014 and is accessible to both personal and commercial Twitter accounts.
Making decisions about your social media strategy based on data becomes easier when you use Twitter Analytics for Business. With the right data, you can improve your Twitter campaigns and get more followers without having to make an educated guess about the effectiveness of your strategy.
Advantages of monitoring Twitter Analytics
Learning what your audience really wants
You can gain important insights into your followers' favourite topics with Twitter Analytics - favourite gifs, videos, polls, photos or posts, even their favourite posting day.
If you don't look at the data, it's almost impossible to predict which content will appeal to your audience.
Tracking your growth
Get rid of your spreadsheets and let Twitter Analytics do the math. Check your subscription and unsubscription data every month to discover your trends.
With analytics, you will learn what kind of content attracts new followers (or repels them).
Figuring out the best time to post
The first thing friends ask me when we go out for dinner is not how I am, but "When is the ideal time to post on Twitter?"
All right, it's a joke. But it’s obviously important information, right? The perfect time is a myth; it doesn't exist for everyone - and that's important to know. It depends on the day of the week and what time zone your audience is in.
Using Twitter statistics, you can determine when your tweets receive the most interaction. It becomes possible to find out the trends depending on the time of day. But don't worry about it too much: 25% of Twitter users in America check it frequently every day, and 42% check it daily.
Want the easy answer? Alright, 8 am on Mondays and Thursdays are the best times to post.
Twitter Analytics Alternatives
With the help of third-party analytics tools, you can delve deeper into content attributes that Twitter Analytics does not provide as much information about. Want details on the effectiveness of hashtags? Perhaps you're interested in learning more about the Twitter accounts with the highest clout in your niche. You'll need assistance from outside sources to locate these metrics.
The most popular Twitter analytics tools and the kinds of data they work best with are listed below. Each of these programs offers free services that can improve your Twitter, even if the majority of them also offer paid subscription plans that give you access to a variety of features.
Klear
Influencer Analytics
 Source: Klear
Find out who is creating the most buzz and having the most impact on specific discussion topics with the help of Klear, a program that specialises in influencer marketing. The application, which is compatible with Twitter, Instagram and YouTube, makes it simple to identify, evaluate and manage connections with the individuals your company wants to be associated with on social media.
Keyhole
Hashtag Analytics
 Source: Keyhole
Keyhole provides an in-depth exploration of the hashtags and subjects on which Twitter users might want to base entire social media campaigns. Search for the hashtags, accounts and topics you wish to follow for free to get started. You can then create monitoring programs using this information and a paid subscription to find out who is saying what about you, your event or your industry.
Twitonomy
User, Keyword and Hashtag Analytics
 Source: Twitonomy
Twitonomy offers a whole host of information about the tweets you create and the people you follow. You have several options to view and report this data, and most are completely free. By logging into Twitonomy via Twitter, you can follow posts from specific people, get smarter insights into your followers and more.
Tweet Binder
Campaign Analytics

Source: Tweet Binder
Tweet Binder is a campaign-focused analytics platform that gives you free access to the activity associated with each hashtag, user or term. You can see the results of your efforts on the Twitter and Instagram ‘walls’ provided by the product's premium plans, ultimately making you a more informed marketer and event promoter. You can get a sense of how simple it is to see the data underlying various Twitter trends by viewing Tweet Binder's free hashtag report, which is displayed above.
RiteTag
Hashtag Analytics

Source: RiteTag
RiteTag uses the engagement analytics behind hashtags to suggest hashtags in real-time for every tweet you write, so it does more than just provide engagement metrics. The platform is linked to numerous social networks and marketing tools, allows you to save ‘tag sets’ for later use and suggests hashtags depending on the language and visual content you want to share.
Mentionmapp
User, Mention and Hashtag Analytics
 Source: Mentionmapp
One of Twitter's few analytics apps, Mentionmapp, displays chat data as a ‘map’. The majority of the application, which not only shows who is talking to whom but also who is working on what topics and where discussions originate, can be used freely on the ‘Seeker’ platform. The map you create will be constantly updated with the latest Twitter trends.
Hashtagify
Hashtag Analytics
Source: Hashtagify
Hashtagify is a hashtag analysis application that provides a dashboard of data for any hashtag you are interested in. You can use the product on both Twitter and Instagram, and it organises the data into different visual categories so you can choose which hashtags and topics are worth participating in. The free version of Hashtagify offers the aforementioned dashboard along with a shortened version of the entire suite of stats, which is accessible only via subscription, similar to the other products on our list.
Best Time to Post on Twitter Based on Analytics Data
Do you know how time affects the results of your tweets? There isn't a single right answer. The ideal time to tweet depends on who your company’s target audience is and the kind of material you provide.
Since each tweet you publish has a limited duration, it is vital to identify peak periods of audience activity to determine the most effective times to post your material. There are steps you can take to learn when to tweet and when to communicate with your followers using different media types.
- Analyse your top tweets
Finding the ideal times to tweet might be as simple as looking at your most popular tweets. Determine the times that are most frequently linked to material that performs well. Try organising your top tweets by time of day when displaying your brand's most popular material. - Measure organic mentions
You can determine peak hours for organic interaction with your brand by tracking mentions of your brand, your handle or hashtags that are not retweets or replies to your tweets. Using this method, the time your brand tweets has no bearing on your understanding of user activity. You can learn when consumers choose to interact with your company by tracking organic mentions over a long time period and taking care to prevent situations that can skew posting times. - Get to know your audience
You can determine when your audience is most likely to be engaged online by knowing where they are situated. You can get a sense of when your audience starts their day, takes their lunch break, etc., by looking at how your audience is distributed by time zone. The further your audience is spread out, the longer your posting window is, and the more important it is to provide specific content for local audiences. - Segment content types by time of day
You may learn more about the times of day and days of the week when particular types of content are more likely to create engagement by segmenting engagement into key content categories. You may find, for instance, that content created to entertain followers is effective at raising engagement on weekends or outside of work hours, while content with calls to action receives greater interaction during peak hours. - Monitor current engagement trends
Your current engagement patterns can be displayed by categorizing engagement by day and hour. This strategy can help determine the optimum days and times to tweet on behalf of your company. By examining this data over a longer time span, excluding engagement outliers and sponsored tweets and experimenting with when you post, you may be able to prevent bias and discover your true peak engagement periods. - Compare competitor engagement
Making sure you don't miss the best moments to tweet also involves comparing the distribution of your rivals' interactions by day and hour. By examining your rivals’ content strategies, you can find publishing times that you may not have tried or types of material that encourage interaction during periods when you’ve had less success.
After learning the basics, evaluate the value of your time spent interacting with your Twitter followers and building awareness of your brand. Now is the time to think about how your social media strategy can increase your sales by turning your Twitter followers into paying customers. Consider how your social media strategy affects your web funnel - specifically, how those tweets are turned into measurable web activity such as clicks or sales. You should research how quickly issues are resolved and how you can improve your social media customer service strategy if your business has a customer service account.
In the end though, you don’t need to spend time analysing and figuring out the best time to post manually, our AI can automatically determine the best time to post for you. Learn more!
Frequently Asked Questions
What can you track with Twitter Analytics?
- Profile visits
The number of visits to your Twitter profile is displayed at the top of your analytics dashboard. This figure is updated daily and covers a 28-day period. It continually compares this data to the previous 28-day period and provides a small graph showing the progression of this data over time. - Mentions
You can see your @mentions over the last 28 days and over time, just like the profile visits metric. Each month, your top mention, based on engagement, is also displayed with a link that takes you directly to that tweet for more context.
Top tip: The mentions section of your analytics dashboard can be a great customer service tool for your brand. Be sure to engage with followers who are asking questions or leaving reviews of your products or services. - Tweet impressions
You can get a list of all of your tweets, along with the number of impressions, in the Tweets section. You can check the performance of each tweet, as well as overviews of recent months or a 28-day snapshot of total impressions. - Tweet engagements and engagement rate
The Tweets section also shows your tweet engagement, which is the total number of interactions received by your tweet, as well as the engagement rate, which is calculated by dividing engagements by impressions. - Top Tweets
Every month, your top tweet and top media tweet will be displayed on your primary analytics dashboard (by impressions). Click ‘View Tweet activity’ to see the exact engagement broken down by detail expands, link clicks, profile clicks, and more.
Seeing all your top tweets per month laid out in the same place allows you to aggregate the data and see what they have in common.
Do they all employ the same brand voice? Do they all include an emoji? What kind of call to action resonates best with your followers? - Follower growth
You can monitor how your following has changed over the past 30 days, as well as how many new followers you've gained daily, in the follower section of your dashboard. Check your tweets from that day to see if you can identify why you either acquired or lost a lot.
You can also consider running a followers campaign to gain engaged new followers. - Video content performance
You can monitor the number of times your videos have been viewed and get a more comprehensive understanding of how viewers react to them if you include video in your content strategy. For instance, do they finish viewing them? - Conversion tracking
Conversion tracking will accurately credit your Twitter ad if a follower interacts with one of your adverts on their mobile device and subsequently purchases your goods on their laptop.
It essentially allows you to track the actions of people who view or engage with your ads on Twitter to calculate your return on ad spend.
Check out our guide for full details on setting up conversion tracking for your website or app.
Is Twitter Analytics free?
You can use this native analytics tool without charge through analytics.twitter.com. The application enables Twitter users to monitor the effectiveness of their tweets.
What is a good engagement rate for Twitter?
For Twitter, the majority would deem anything above 1% outstanding, while 0.5% is generally considered a respectable engagement rate. Smaller companies should strive for an engagement rate that is consistently greater than 1%.
How to get a Twitter Analytics report?
Visit analytics.twitter.com on a desktop or laptop computer and choose ‘Tweets’. Or, in the Twitter app for iOS or Android, tap the analytics symbol in the bottom corner of a tweet.
Can I access the Twitter Analytics of another account?
Twitter Analytics only gives you access to your own Twitter metrics. You cannot access the Twitter metrics of other users directly through Twitter.
Why is it important to track Twitter Analytics?
Twitter Analytics reveal your audience's reaction to your material, along with what is and is not effective. Use this information to improve your upcoming Twitter campaigns and increase your ROI.
Conclusion
Compared to other corporate operations, such as marketing and communication channels, it is simple to alter your social media strategy as necessary.
There is no need to get stuck for months using a particular social strategy while your business changes and evolves every day.
You can learn what works and what doesn't by periodically analysing your social performance, which can help you make better business decisions. Being able to swiftly change course is usually advantageous in a small business environment.
After you’ve established your goals and determined which indicators are important to your business, it's time to begin tracking. Don't be intimidated by the statistics or what appears to be an enormous quantity of data; with the correct planning, tools, and ‘best practices’, you'll get the most out of your Twitter efforts.