Conte.ai research reveals what England's restaurants are doing on social media

by Alex Bogins 15 minutes read updated on March 26, 2023
What is the least used social network among restaurants in England?
"If anything, food is a more intimate form of art compared to others, as it incorporates all of the senses", says Dominique Ansel, inventor of the Cronut. Indeed, in human hands, dining may rise to the level of high art. Restaurants are at the very heart of it. However, how well can they communicate this through social media?
We researched how restaurants in England behave on Instagram, Facebook, Twitter, and LinkedIn. We discovered what their accounts consist of, what kinds of posts are published the most, what style of communication restaurants apply, and much more.
We also performed an in-depth analysis of the Restaurant Gordon Ramsay's, The Walmer Castle's, and Porte Noire's accounts.
Parts of the study were carried out by our analysts, and others were completed using AI. We found a perfect blend of artificial and natural intelligence to present a highly detailed report on England's restaurants’ behaviour on social media.
To begin with, let's see what we found about restaurants on Instagram, Facebook, Twitter, and LinkedIn in general. Then we'll move on to the three restaurants owned by famous public figures and proceed to specific features of each social media platform separately.

What's common on England's restaurants' accounts

89.4% of restaurants use hashtags on social media.
10.6% don't do it.
88% of restaurants use emojis on social media.
12% don't do it.
47.4% of restaurants vary their profile descriptions on different social networks, 36.8% duplicate them on two of the platforms used, and 15.8% place the same text on three platforms.
55% of restaurants use a colloquial style of communication on their social media accounts. 45% write in a neutral style.
13.6% of restaurants express gratitude to their visitors in the posts. 86.4% don't do it.
20% of restaurants publish shots of their clients. 80% choose not to do it.
22% of restaurants share snaps taken by their followers. 78% only post content produced by their team.
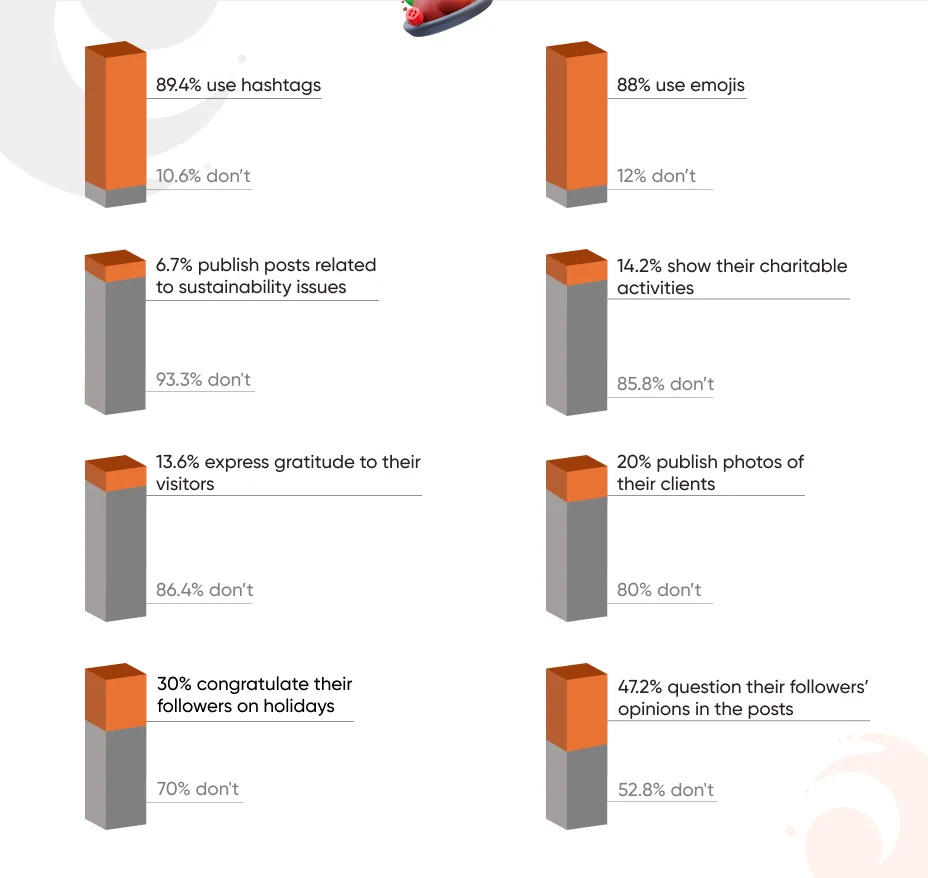
30% of restaurants congratulate their followers on numerous holidays. 70% don't use their social network accounts for this purpose.
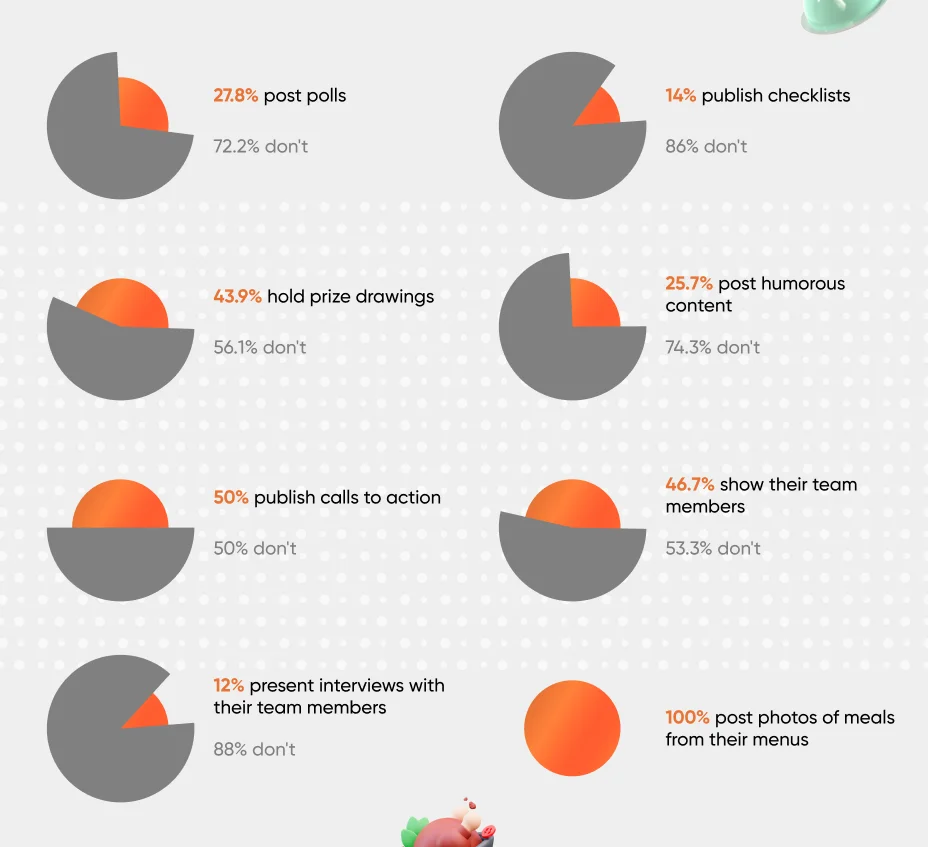
46.7% of restaurants introduce their team members to the public on social media.
53.3% choose not to do it.
12% of restaurants present interviews with their team members. 88% don't produce this type of content.
27.8% of restaurants communicate with their followers via posts, including polls. 72.2% don't offer voting.
47.2% of restaurants communicate with their followers by questioning their opinions in the posts. 52.8% don't do it.
100% of restaurants post photos of meals from their menus.
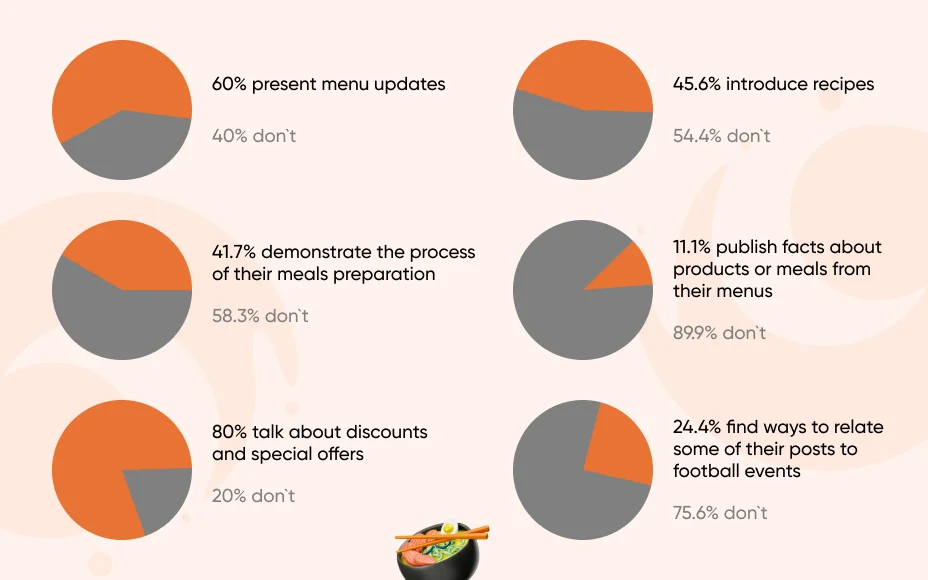
60% of restaurants let their followers know about menu updates. 40% don't post about it.
31% of restaurants inform followers about their regular offers for different meals throughout the day (e.g. breakfast or lunch). 69% don't post about them.
41.7% of restaurants demonstrate the process of their meal preparation on social media. 58.3% don't show it.
45.6% of restaurants introduce recipes on their social media profiles. 54.4% prefer not to share them.
11.1% of restaurants publish facts about products or meals from their menus. 88.9% don't post this kind of content.
80% of restaurants notify their social media audience about discounts and special offers. 20% don't talk about them.
6.7% of restaurants publish posts related to sustainability issues. 93.3% prefer not to elaborate on this topic.
14.2% of restaurants show their charitable activities. 85.8% don't do it.
25.7% of restaurants publish humorous content. 74.3% publish only neutral posts.
14% of restaurants publish various kinds of checklists. 86% don't create them on their social media accounts.
56.1% of restaurants hold prize drawings on their accounts. 43.9% don't make use of them.
27.7% of restaurants publish historical posts. 72.3% don't do it.
50% of restaurants publish calls to action on their accounts. 50% don't use imperative verbs.
24.4% of restaurants find ways to relate some of their posts to football events. 75.6% don't draw parallels between their restaurant and football.
1.9% of followers on a restaurant's account interact (like/comment/share) with a single post on average.
During the week, followers interact with posts most actively on Wednesdays but least on Sundays.
During the day, followers interact with posts most actively between 14.30 and 17.00 GMT.

Restaurant Gordon Ramsay, The Walmer Castle and Porte Noire on social media

Gordon Ramsay owns and runs his signature restaurant, Restaurant Gordon Ramsay. It was Ramsay's first standalone restaurant, and it debuted in 1998. Three Michelin stars were given to it in 2001, and in 2022 the restaurant managed to keep all of them.
Even though the purchase of the Walmer Castle pub in Notting Hill by David Beckham and Guy Ritchie in 2018 generated a lot of media attention, it was discreetly taken over by businessman and hotelier Piers Adam in February 2022. It has reopened as a restaurant, cocktail and whisky bar.
Idris Elba, a DJ, producer, and actor who is best known for his work on "Luther" and "The Wire", may now add another honour to his record. Elba opened his first bar and restaurant, Porte Noire, with business partner David Farber, the creator of Connaught Wine Cellars.
Discover below what these three saloons are doing on their social media accounts.
Restaurant Gordon Ramsay (RGR)

Restaurant Gordon Ramsay (RGR)

The restaurant is present on Instagram, Twitter (posting here stopped in Feb 2020), Facebook, and LinkedIn.
The top three hashtags throughout
the restaurant's social media presence:
  • #restaurantgordonramsay
  • #oneteamonedream
  • #michelin
The volume of posts published across RGR's socials:
31.4% are on Instagram
22.5% are on LinkedIn
  • 0.9% of followers on RGR's profile interact with a single post on average.
  • Restaurant Gordon Ramsay uses a neutral communication style on its social media accounts.
The types of posts Restaurant Gordon Ramsay publishes on its social networks:
Twitter
  • 58.6% foodporn
  • 11.2% restaurant events
  • 10.5% calls to action
  • 9.2% casual photos
  • 3.9% menu updates
  • 3.2% holiday greetings
  • 2.3% significant dates for the restaurant
  • 1.1% other
LinkedIn
  • 54.8% photos and videos of the team
  • 25.8% new branch openings and interior demonstrations
  • 4.1% calls to action
  • 3.3% restaurant events
  • 3% holiday greetings
  • 2.9% team members' birthday greetings
  • 2.8% foodporn
  • 2.7% their unique products presentations
  • 0.6% other
Both the Facebook and Instagram pages of RGR are balanced with photos of people and food in equal proportions.
The Walmer Castle (TWC)

The Walmer Castle (TWC)

The restaurant is present on Instagram, Facebook, and LinkedIn.
The top three hashtags throughout
the restaurant's social media presence:
  • #nottinghill
  • #london
  • #portobelloroad
The volume of posts published across TWC's socials:
44.9% are on Instagram
4.1% are on LinkedIn
  • 1.5% of followers on TWC's profile interact with a single post on average.
  • The Walmer Castle uses a colloquial language style on its social media accounts.
The types of posts The Walmer Castle publishes on its social networks:
Facebook
  • 18.3% calls to action
  • 15.7% announcements
  • 12.6% interior/exterior photos
  • 12.2% posts about their meals (a photo and a note)
  • 11.8% restaurant news (e.g. opening hours on holidays)
  • 6.8% foodporn
  • 5.1% interactive posts
  • 4.7% team photos
  • 2.8% giveaway posts
  • 2.6% menu updates
  • 2.5% vacancy posts
  • 2.2% casual photos
  • 1.8% charity posts
  • 0.9% other
LinkedIn
  • 34.3% vacancy posts
  • 17.2% restaurant news
  • 16.6% foodporn
  • 16% announcements
  • 15.9% interior/exterior photos
Instagram posts of the restaurant duplicate Facebook content for 90%. The remaining 10% are other videos of meals, restaurant news, and events (past and future).
Porte Noire

Porte Noire

The restaurant is present on Instagram, Facebook, and LinkedIn.
The top three hashtags throughout
the restaurant's social media presence:
  • #winebar
  • #winelover
  • #portenoirewines
The volume of posts published across Porte Noire's socials:
65.2% are on Instagram
0% are on LinkedIn (empty page)
  • 0.8% of followers on Porte Noire's profile interact with a single post on average.
  • Porte Noire uses a colloquial communication style on its social media accounts.
The types of posts Porte Noire publishes on its social networks:
Facebook
  • 55.6% professional photos of branded wine or champagne with catchy notes
  • 16.7% quotes
  • 13% restaurant features (e.g. dog-friendly) and achievements
  • 7% Elba's photos
  • 4.7% recipes
  • 3% other
Instagram
  • 20.2% calls to action
  • 15.4% professional photos of branded wine or champagne with catchy notes
  • 11.6% interactive posts
  • 10.1% announcements
  • 9.1% restaurant news
  • 8.4% casual photos or videos
  • 8.3% restaurant features (e.g. dog-friendly) and achievements
  • 7.9% foodporn
  • 4% discounts
  • 2.9% holiday wishes
  • 2.1% other
The LinkedIn page doesn't have any posts at all.
Now it's time to look at each of the social networks separately. More categorised data on the restaurants’ accounts on Instagram, Twitter, Facebook, and LinkedIn is presented below.

Instagram as the restaurants' playground

75.4% of restaurants have accounts on Instagram. 24.6% aren't present on this social network.
Among those with existing Instagram pages…
96.3% of restaurants fill in their profile descriptions on Instagram. 3.7% leave them empty.
68.4% of restaurants place professional photos on their Instagram accounts. 31.6% publish casual photos.
52.6% of restaurants include emojis in their profile descriptions on Instagram. 47.4% don’t place them there.
63.2% of restaurants add a business category in their profile descriptions on Instagram. 36.8% leave this space empty.
84.2% of restaurants have the Story Highlights section filled in on their Instagram accounts. 15.8% don’t upload anything to it.
79% of restaurants upload vertical videos called ‘Reels’ on Instagram (best suited for smartphones). 21% don’t use this format.
15.8% of restaurants upload Instagram Guides. 84.2% don't use the format of little blogs on the platform.
16% of restaurants have verified accounts on Instagram. 84% don’t have verification check marks near their account names.
89.5% of restaurants regularly publish posts on Instagram. 10.5% are inactive.
On average, 1.6% of followers on a restaurant’s account interact with every single post on Instagram.
23.3% is the maximum volume of followers on an English restaurant’s account that interact with a single post on Instagram.
The three most interesting post topics for restaurants’ followers on Instagram:
23.3% of followers interact with posts containing splashy dish photos (aka foodporn);
15% of followers interact with posts about restaurant’s birthdays;
10.6% of followers interact with posts about giveaways.
The three least interesting post topics for restaurants’ followers on Instagram:
1.4% of followers interact with posts presenting their specials;
1% of followers interact with posts, including guests' pictures;
0.1% of followers interact with posts that include short videos on various topics.
During the week, followers interact with restaurants’ posts on Instagram, most on Tuesdays and least on Fridays and Sundays.
During the day, followers interact with restaurants’ posts on Instagram most actively between 11.30 and 16.00 GMT.
27 posts is the average number that restaurants publish on their Instagram accounts per month.

Twitter as the restaurants' playground

43.8% of restaurants have accounts on Twitter. 56.2% aren't present on this social network.
Among those with existing Twitter pages…
92.8% of restaurants have cover photos on Twitter. 7.2% don't upload this profile element.
98% of restaurants fill in their profile descriptions on Twitter. 2% leave them empty.
20.9% of restaurants include emojis in their profile descriptions on Twitter. 79.1% don’t place them there.
22.1% of restaurants have verified accounts on Twitter. 77.9% don’t have verification check marks near their account names.
64.3% of restaurants regularly publish posts on Twitter. 35.7% are inactive.
28.6% of restaurants created their Twitter accounts before 2010. 71.4% registered them in 2010 and later.
On average, 3.2% of followers on a restaurant’s account interact with every single post on Twitter.
9.5% is the maximum volume of followers on a restaurant’s account that interact with a single post on Twitter.
The three most interesting post topics for restaurants’ followers on Twitter:
9.5% of followers interact with humorous posts or memes;
5.5% of followers interact with posts that include a casual everyday video with a short note;
3.5% of followers interact with posts about giveaways.
The three least interesting post topics for restaurants’ followers on Twitter:
0.6% of followers interact with posts that include pictures of various dishes;
0.2% of followers interact with posts that include discounts or special offers;
0.02% of followers interact with posts that include a link to a delivery website.
During the week, followers interact with restaurants’ posts on Twitter, most on Saturdays and least on Thursdays.
During the day, followers interact with restaurants’ posts on Twitter most actively between 14.30 and 20.30 GMT.
36 posts is the average number that restaurants publish on their Twitter accounts per month.

Facebook as the restaurants’ playground

86.8% of restaurants have accounts on Facebook. 13.2% aren’t present on this social network.
Among those with existing Facebook pages…
97% of restaurants have cover photos on Facebook. 3% don’t upload this profile element.
94.7% of restaurants fill in their profile descriptions on Facebook. 5.3% leave them empty.
4.8% of restaurants include emojis in their profile descriptions on Facebook. 95.2% don’t place them there.
10.4% of restaurants have verified accounts on Facebook. 89.6% don’t have verification check marks near their account names.
23.3% of restaurants publish content in the ‘Featured’ section on Facebook. 76.7% don’t do it.
79% of restaurants regularly publish posts on Facebook. 21% are inactive.
On average, 1.2% of followers on a restaurant’s account interact with every single post on Facebook.
2.9% is the maximum volume of followers on a restaurant’s account that interact with a single post on Facebook.
The three most interesting post topics for restaurants’ followers on Facebook:
2.9% of followers interact with posts about being back on socials;
1.6% of followers interact with posts about charitable activities;
1.4% of followers interact with posts containing splashy dish photos (aka foodporn).
The three least interesting post topics for restaurants’ followers on Facebook:
0.6% of followers interact with live performance announcements;
0.3% of followers interact with humorous posts;
0.2% of followers interact with posts about festive lunches and dinners.
During the week, followers interact with restaurants’ posts on Facebook, most on Wednesdays and Thursdays and least on Sundays.
During the day, followers interact with restaurants’ posts on Facebook most actively between 19.00 and 23.00 GMT.
20 posts is the average number that restaurants publish on their Facebook accounts per month.

LinkedIn as the restaurants' playground

2.8% of restaurants have accounts on LinkedIn. 97.2% aren't present on this social network.
Among those with existing LinkedIn pages…
91.7% of restaurants have cover photos on LinkedIn. 8.3% don't upload this profile element.
85.6% of restaurants fill in their profile descriptions on LinkedIn. 14.4% leave them empty.
100% of restaurants have the longest profile descriptions on LinkedIn compared to their accounts on other platforms.
7.1% of restaurants include emojis in their profile descriptions on LinkedIn. 92.9% don’t place them there.
57.1% of restaurants regularly publish posts on LinkedIn. 42.9% are inactive.
On average, 1.5% of followers on a restaurant’s account interact with every single post on LinkedIn.
24.8% is the maximum volume of followers on a restaurant’s account that interact with a single post on LinkedIn.
The three types of posts that restaurants publish the most on LinkedIn:
34% publish posts about the restaurant’s news;
22% publish charity posts;
15% publish posts about growth and development results.
The three types of posts that restaurants publish the least on LinkedIn:
5.3% publish vacancy posts;
3.6% publish posts about partnerships;
1.2% publish posts about various events.
During the week, followers interact with the restaurant's posts on LinkedIn, most on Wednesdays and least on Sundays.
During the day, followers interact with the restaurant’s posts on LinkedIn most actively between 12.00 and 17.00 GMT.
6 posts is the average number of posts that restaurants publish on their LinkedIn accounts per month.

Time to sum up

Interestingly, food appeared to be far from the only type of content published on restaurants’ accounts. Research showed that the popularity of different social media platforms significantly varies among restaurants in England. It was also discovered that restaurants choose what content to publish on their accounts and what communication style to use. Many things united them. However, there were also a few traits that made the profiles stand out from the rest.
Below is a list of post types that are unusual for most of the restaurants' accounts but are found in one or some of them:
  • Posts where football is intertwined with food presentation;
  • Memes;
  • Posts about a restaurant’s history;
  • Posts with a special toy as 'a new team member' for the Christmas period;
  • Posts with cats together with a restaurant’s meals;
  • Posts with famous quotes adapted to food;
  • Posts with a restaurant’s location presentation.
Get up to 10X more social media followers and clients
Awesome, effective, and unique posts
Automatic posting to your accounts
Autopilot runs without your input